|
Is The Covid-19 Pandemic A Black Swan Or A Gray Rhino Event?
Part 1: COVID-19’s possible spread in India
Sagar Dhara
The COVID-19 (the disease that the coronavirus causes) outbreak in India is a disaster in the making, akin to several disasters that have occurred in the past, e.g., 1984 Bhopal gas tragedy, 1999 Ersama cyclone. They start as a health crisis and quickly morph into a humanitarian and an economic crisis.
To understand the COVID-19 pandemic, the following questions need answers:
-
What will COVID-19 spread look like in India?
-
How is India coping with COVID-19? Is India prepared for a COVID-19 outbreak?
-
Is the COVID-19 pandemic a black swan or a gray rhino event? How can their impacts be mitigated?
-
Why do such events recur? What important policy shifts are required?
Part 1: COVID-19’s possible spread in India
Coronavirus spread
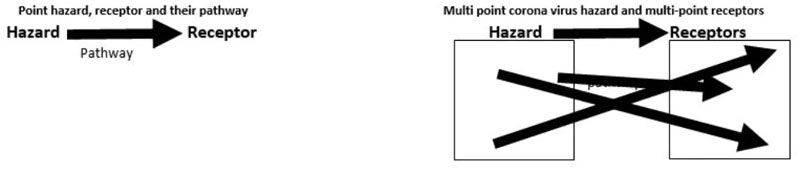
The coronavirus is like any other hazard. It takes a certain pathway and hits the receptors. The important receptors for a virus are humans and surfaces of objects. For some hazards, e.g., a tornado, the receptor could also be the environment to which it causes damage. Risk management is the understanding of the interplay between a hazard, its pathway, and the receptors it strikes, and the impact it causes (see Box 1 for an explanation of the dynamics between hazards, pathways, and receptors).
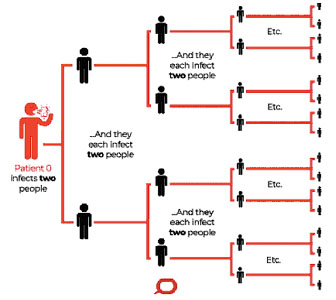
Most hazardous scenarios usually have a single point static or mobile hazard location, e.g., a volcano, with the receptors located in a single area, e.g., a 10 km radius around the volcano, and a pathway that is linear. Since infected persons are mobile and infect people wherever they travel through sneeze and cough droplets, a virus outbreak is a complex as it is multi-point hazard and receptor scenario, with an almost infinite number of pathways between the hazard and its receptors.
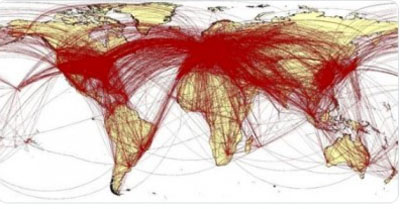
Transmission and spread of COVID-19
As people from Wuhan travelled, they carried the virus to other parts of China and abroad. Places better connected to Wuhan were affected earlier, e.g., Europe. The disease then spread to other onward destinations. There is a visible correlation between COVID-19 incidence and population mobility (and carbon emissions). In India, states with greater population mobility--Maharashtra, Delhi, and Tamil Nadu, have significantly larger caseloads compared to the North eastern states. In the US, coastal populations that are more connected to the world, had higher caseloads.
Once a country is seeded with ‘imported cases’ in Stage 1 of the disease, it may progress to three more stages. In Stage 2, ‘local transmission,’ an imported case infects local contacts. In Stage 3, ‘community transmission,’ the infection spreads in the community and can no longer be traced to an imported case or his contacts. Stage 4 is an epidemic.
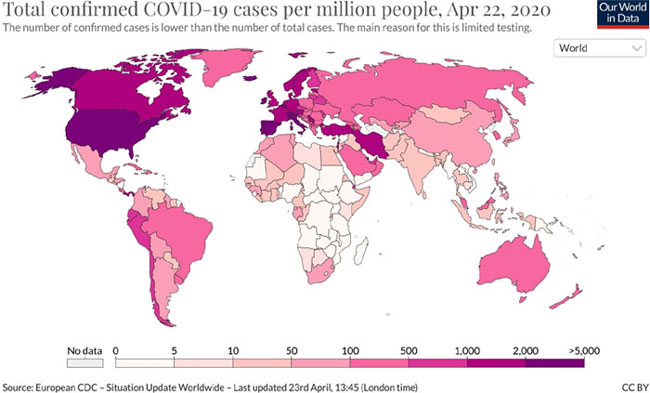
Confirmed COVID-19 cases per million people, 22 April 2020
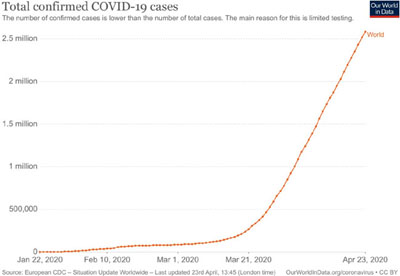
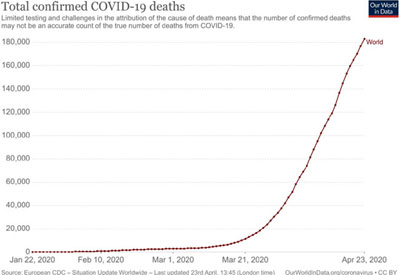
Global toll
On 23 April 2020, the number of detected cases[1] worldwide was 2.6 million with a doubling time of 17 days, and deaths attributed to coronavirus were 1.8 lakhs. Detected cases and deaths are in exponential growth with little sign of slowing down.
Total global COVID-19 cases and deaths since January 2020
Dt in 2020 |
Total confirmed cases |
Daily new confirmed cases |
Total confirmed deaths |
Daily new confirmed deaths |
1 January |
27 |
0 |
0 |
0 |
1 February |
11,946 |
2,120 |
259 |
46 |
1 March |
67,024 |
1,821 |
2,979 |
58 |
1 April |
851,308 |
73,512 |
41,885 |
4,614 |
15 April |
1,950,000 |
75,224 |
125,975 |
6,983 |
23 April |
2,590,000 |
67,629 |
182,808 |
6,022 |
|
|
|
|
|
Confirmed COVID-19 cases on 23 Apr 2020
Confirmed COVID-19 deaths on 23 Apr 2020 2020
Bean counting: Forecasts of modelling studies
Just before India locked down on 25 March, two modelling studies that forecast the incidence of COVID-19 cases in India with and without non-pharmaceutical interventions (NPI), e.g., physical distancing (what was earlier known as social distancing is now also called physical distancing) were published. Another three studies were published subsequently (see Box 2). The results of all the studies have considerable uncertainty, which is inherent to such studies where little is known about the virus.
The results of the studies vary widely. With no NPI, COVID-19 incidence forecasts range 2-800 million, and with NPI, 650-242,000 cases. The wide variation in forecasts is due to differences in the equations and input data used, and the assumptions made in the studies. Case incidence forecasts at the lower end in some studies are now proven to be under-estimates as the number of cases in India now exceeds 22,000.
One study that did city specific forecasts for Delhi, Mumbai, Kolkata, and Bengaluru may yet come close to what may happen. The forecast for Delhi, the city with the maximum predicted cases among these cities, ranges 14.5-110 lakhs without NPI, and 2-97 lakhs with NPI. At the other end, in Bengaluru which is likely to have the least number of cases, the number of predicted cases ranges 3.5-23 lakhs without NPI and 0.7-22 lakhs with NPI. All studies agree that with no NPI, case numbers will be exceedingly high.
The two studies that were published between 22-24 March are unlikely to have influenced India’s lock down decision as their publication was too close to the event. The other three studies were published after the lockdown, therefore could not have influenced the decision.
The one study that may have influenced India’s lockdown decision is the Imperial College study that was published on 16 March. This study forecast that with no NPI, 81% of the populations of Great Britain (GB) and USA would be infected, and that 0.51 and 2.2 million persons would die in GB and USA countries, respectively. Their public health care systems would be overwhelmed by the massive caseloads, and hence a shift was required from a mitigation to a suppression strategy. GB shifted gears drastically and jumped from no restrictions to national lockdown a week after the Imperial College study was published. Two days later India followed GB.
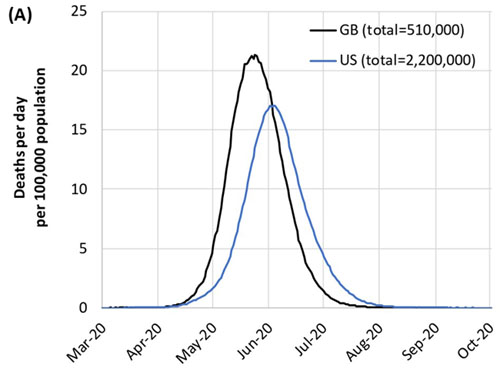
Imperial College study forecast
To understand why GB and India did a sudden U-turn in their COVID-19 containment strategy, it is important to understand how risk mitigation is done.
Risk mitigation methods
There are six ways to nullify or reduce the risk from a natural or manmade hazard: 1) remove the hazard, 2) remove humans and other receptors, 3) enclose the hazard, 4) enclose humans and other receptors, 5) increase the pathway length between the hazard and the receptors so that the hazard intensity decreases when it hits the receptor, 6) break the pathway so that hazard does not reach the receptors (see Box 3: Risk mitigation).
Not all six measures are available for every hazard, e.g., a cyclone cannot be removed or enclosed nor can humans be removed from its pathway. But humans can be enclosed in a shelter or evacuated before the cyclone makes landfall. One of these six methods is not available for a coronavirus hazard--removing humans and other receptors such as surfaces that humans touch, e.g., chairs, as they exist everywhere (method #2 in Box 3). The other five methods reduce risk for a limited period and in a limited space, but never remove risk completely.
Flattening the curve
In a virus outbreak, the disease tends to spread quickly in a population after it is seeded by an infected person. A rapid rise of cases in the ascendant phase of the disease can often overwhelm even a good health care system, leaving many patients without adequate care. ICU beds and ventilators ran out in Italian hospitals in March 2020, and doctors had to make choices about which patients to give beds and ventilators. To avoid overstretching the health care system, disease control strategies attempt to flatten the curve by beating down the peak number of cases and spreading them over a longer time period.
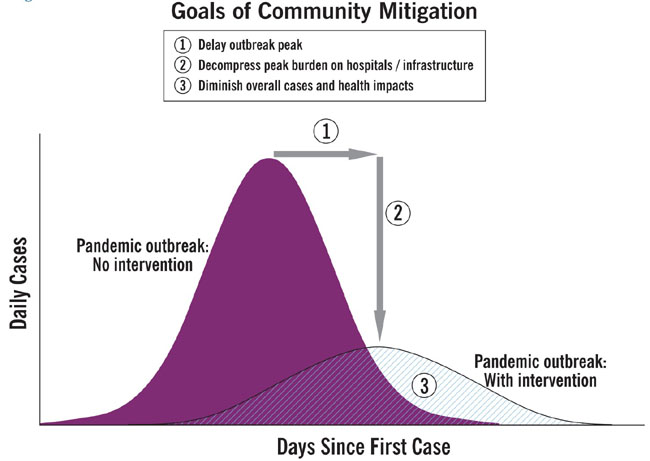
Flattening the curve
Mitigation and suppression strategies
The curve can be flattened using either a mitigation or a suppression strategy, or sometimes a combination of both where a mitigation strategy is used countrywide and a suppression strategy is used in local hotspots. A mitigation strategy uses NPI not to interrupt transmission completely, but to slow it down. It does this by home-isolating mild cases, quarantining suspect cases and, their families and contacts, hospitalizing severe cases, using physical distancing, and possibly shutting educational institutions, and closing borders with some or all countries. The specificity of a circumstance determines the combination of mitigation measures deployed.
A suppression strategy attempts to retard infection spread by breaking the pathway between the virus and humans through lockdowns of communities, towns, districts or even a country, and ordering everyone, barring essential service workers, to stay home. This measure is in addition to all the measures used in a mitigative strategy.
Mitigation and suppression strategies and their limitations
Hazard control method |
Actions |
Strategy |
Limitations |
| 1. Remove hazard |
Washing hands, sanitizing surfaces |
Mitigation, Suppression |
Limited in time & space. Person & surfaces can be re-contaminated, Other persons & surfaces not sanitized may carry infection |
| 2. Remove humans |
Not possible |
-- |
-- |
| 3. Enclose hazard |
Isolate cases, quarantine suspected cases & persons they contacted |
Mitigation, Suppression |
Limited in time & space. Other persons outside isolation/ quarantine may carry the infection |
| 4. Enclose humans |
Personal protective equipment |
Mitigation, Suppression |
Can be used only by health workers |
5. Increase pathway length |
Keep physical distance of 1-2 m between people, no physical contact |
Mitigation, Suppression |
Everyone may not follow physical distancing or may not be able to do it they live & travel in crowded houses and transport |
6. Break pathway |
Lockdown community/ cities/ districts/ country-- Everyone, except essential services workers are isolated at home |
Suppression |
Social life and the economy will be impacted as supply chains of products & services are broken. |
A mitigation strategy allows for the disease to spread in a controlled way in the population thereby allowing the population to gain ‘herd immunity,’ thus reducing the probability of a repeat disease outbreak. If the disease transmission is moderately high, and the number of cases exceeds the maximum capacity of health services, it may be stretched badly or even be overwhelmed.
By isolating everyone, a suppression strategy reduces disease transmission and caseload to low levels, allowing health services with limited capacity to cope. Since the population lacks immunity, the probability of a disease outbreak is high after lifting the lockdown; requiring repeated lockdowns till a vaccine is available or the virus weakens in time.
The Imperial College study illustrates this process for GB and USA (see figures and table below).
ICU beds required/1 lakh population in GB for various combination of actions for mitigation and suppression strategies
Action |
ICU beds required per 1 lakh population |
|
Mitigation strategy |
Suppression strategy |
Do nothing |
275 |
275 |
Close schools & universities |
245 |
|
Case isolation |
190 |
|
Case isolation + household quarantine |
130 |
|
Case isolation + household quarantine + social distancing of >70 year-olds |
90 |
|
Case isolation + household quarantine + general social distancing |
|
16 |
School & university closure + case isolation + general social distancing |
|
6 |
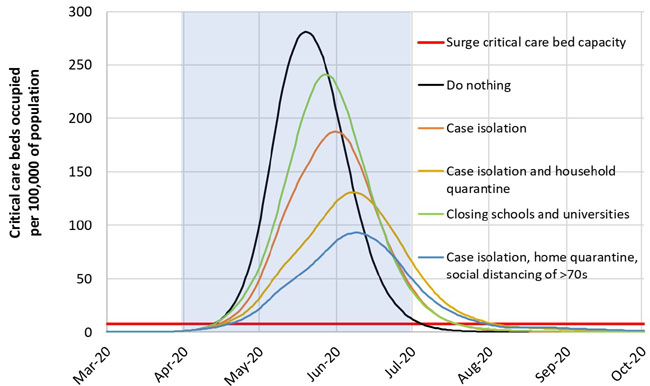
Mitigation strategy scenarios for GB indicating ICU bed requirement for various mitigation methods
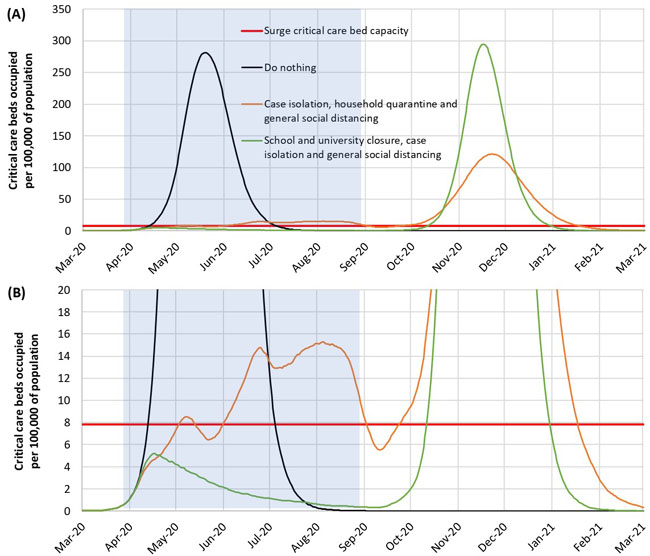
Suppression strategy scenarios for GB showing ICU bed requirements
GB has a surge capacity of 8 ICU beds per 1 lakh population. But the requirement for ICU beds for a mitigation strategy exceed GB’s ICU bed surge capacity by a factor of 10-35 times for different mitigation measures. However, GB’s ICU beds surge capacity can more or less meet the projected ICU bed demand if a suppression strategy is used, the downside being that these measures must be in place for 5 months and may have to be repeated subsequently.
How many Indians will catch COVID-19 in the near future?
The total number of cases and deaths that may occur in India depends on the strategy that the country adopts. Since that is yet not clear, it is difficult to do forecasts with any degree of accuracy.
Risk management
Risk management is the understanding of the interplay between a hazard, its pathway, and the receptors it may strike and the impact it causes to them, in order to reduce risk the hazard poses to the receptors.
A hazard is a substance—toxic chemical, virus; or energy—ionizing radiation, earth’s, e.g., as is released in an earthquake, that may cause injury to humans, or their life support systems prevalent in the environment. Hazards may be natural, e.g., tornadoes or man-made, e.g., explosions. Hazardous may strike suddenly and without much warning, e.g., earthquakes, giving no time for doing hazard control, or may act over time to cause a slow deterioration of the life support systems in the environment, e.g., global warming,
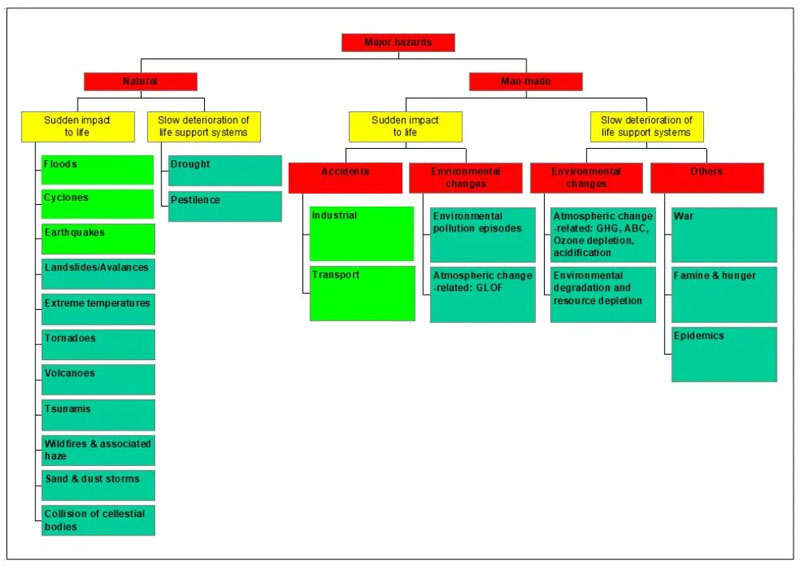
Suppression strategy scenarios for GB showing ICU bed requirements
A hazard travels through a pathway before it strikes a receptor. Pathways may be of through a single medium, e.g., as happens in an explosion when an energy release is transmitted through air, or through several media, e.g., as happens in the release of mercury from thermal power plants, where the mercury travels first through air from the power plant stack to grass. The grass is eaten by cattle. The mercury in cattle milk then goes into humans.
A receptor is the object that the hazard hits after travelling through the pathway. A receptor may be a human or any part of the environment. In the case of the Corona virus, the receptor is a human.
Most hazards are point sources, i.e., they emanate at a one point, e.g., a volcano or a flammable gas leak. And most receptors, whether human or environmental, are also point or area receptors, i.e., they are in one area. Corona virus is a multi-point hazard as it can be present at innumerable places and its receptors are also multi-point as people and surfaces that may be contaminated are spread all over the world.
Expected number of COVID-19 cases in India—results of 2 studies published before the 25 March lockdown and 3 studies published after the lockdown
Studies published before the lockdown |
Study title |
Predictions and role of interventions for COVID-19 outbreak in India[2] |
COVID-19 for India Updates |
Authors |
D Ray, R Bhattacharyya, L Wang, M Salvatore, S Mohammed, A Halder, Y Zhou, P Song, S Purkayastha, D Bose, M Banerjee, V Baladandayuthapani, P Ghosh, B Mukherjee |
E Klein, G Lin, K Tseng, E Schueller, G Kapoor, R Laxminarayan |
Published on |
22 March 2020 |
24 Mar 2020 |
Predicted cases |
Interventions |
No of expected cases & dates |
Scenarios |
No of expected cases & dates |
No interventions |
2.2 million cases by mid-May |
High trajectory-no effect of current lockdowns and a rapid spread |
Total peak number of cases-25 crores by end-Apr |
Travel ban only |
6.6 lakh cases by mid-May |
Medium trajectory-No effect of lockdown or temperature/ humidity sensitivity, consistent with data from Italy (more likely scenario) |
Total peak number of cases-18 crores by mid-May |
Travel ban + Social quarantine |
55,200 cases by mid-May |
Low trajectory-Decreased transmission, potentially due to temperature/ humidity sensitivity |
Total peak number of cases-12.5 crores by mid-June |
Travel ban + Social quarantine + Lockdown |
13,800 cases by mid-May |
|
|
|
|
|
|
|
Study published after the lockdown |
Study title |
Age-structured impact of social distancing on the COVID-19 epidemic in India[2] |
Healthcare impact of COVID-19 epidemic in India: A stochastic mathematical model |
Authors |
R Singh, R Adhikari |
K Chatterjee, A Kumar, S Shankar [3] |
Published on |
26 March 2020 |
2 Apr 2020 |
Predicted cases |
Interventions |
No of expected cases & dates |
Interventions |
No of expected cases & dates |
Without mitigation |
Total of 0.9 bill cases, with a peak of 167 mill cases by end-June. Total mortality of ~3.6 mill persons. |
Uninterrupted epidemic in India |
Resulted in over 364 million cases & 1.56 million deaths, peak by mid-July |
3 consecutive lockdowns of 21, 28 & 18 days starting 25 Mar, with two 5-day unlocked intervals between lockdowns; or a single 49-day lockdown starting 25 March |
657 cases |
Immediate institution of NPIs |
Epidemic might still be checked by mid-April 2020. It would then result in 241,974 total infections, 10,214 hospitalizations, 2,121 ICU admissions and 1,081 deaths. |
Expected number of COVID-19 cases in 4 major Indian metro hubs with and without intervention
Study title |
Prudent public health intervention strategies to control the coronavirus disease 2019 transmission in India: A mathematical model-based approach |
Authors |
S Mandal, T Bhatnagar, N Arinaminpathy, A Agarwal, A Chowdhury, M Murhekar, R R Gangakhedkar, S Sarkar |
Published on |
28 March 2020 |
Predicted peak number of cases |
Intervention |
Scenarios |
Predicted peak number of cases in lakhs (approx) |
Delhi |
Mumbai |
Kolkata |
Bengaluru |
Without intervention |
Pessimistic |
110 lakhs in 45 days |
47.5 lakhs in 50 days |
38 lakhs in 55 days |
23 lakhs in 50 days |
Optimistic |
14.5 lakhs in 210 days |
7 lakhs in 300 days |
5 lakhs in 300 days |
3.5 lakhs in 300 days |
With intervention |
Pessimistic |
97 lakhs in 45 days |
45 lakhs in 55 days |
33 lakhs in 55 days |
22 lakhs in 55 days |
Optimistic |
2 lakhs in 620 days |
1 lakh in 725 days |
0.7 lakhs in 725 days |
0.7 lakhs in 725 days |
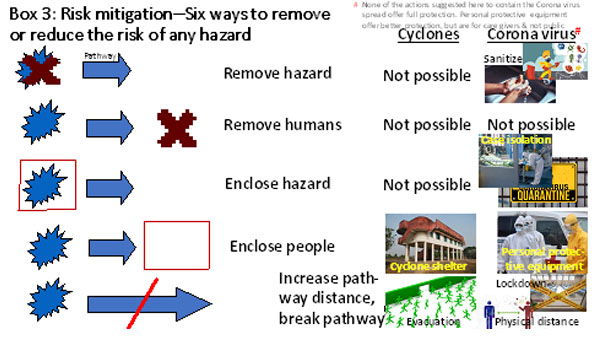
Not all 6 methods are available for all hazards, e.g., a cyclone cannot be enclosed nor can humans be removed from the pathway of viruses. Five actions are available to reduce the risk of the Corona virus:
1. Remove hazard: The virus can be removed by washing hands or sanitizing surfaces. These measures work only briefly as re-contamination is possible, besides it is impossible to sanitize all surfaces.
2. Remove humans: This action is not possible as humans are very widely spread.
3. Enclose hazard: Infected persons are put into isolation wards and those suspected to be infected are quarantined so that the infection is enclosed in the containment facility. But persons outside the isolation ward or quarantine may be infected.
4. Enclose humans: Personal protective equipment (PPE) may be used to enclose health workers, but it is impossible to have everyone use PPEs.
5. Increase pathway distance: Physical distancing by 1-2 m increases the pathway between humans and minimizes the chance of the virus in a infected person’s cough or sneeze droplets reaching the other person.
6. Break pathway: Closing educational institutions is a way to break the pathway. But the break is partial as there are other ways that people meet, e.g., at work, in the market. Lockdowns are a more complete way of breaking the pathway as they minimize contact between infected persons and surfaces and uninfected persons by isolating everyone except those involved with essential services. Lockdowns include shutting educational institutions, factories, commercial establishments, markets, public transport services, etc.
References:
1. Detected cases depend on testing. The actual number of cases may be much higher as testing may not have detected all cases, hence per cent mortality may be at variance from CFR.
2. Predictions for India adjusted for Mumbai, Pune, Kochi and Bengaluru populations. Summary of study available in link.
3. Update to the study available at https://github.com/rajeshrinet/pyross
The author is an environmental engineer with specialization in risk analysis
Back to Home Page
May 10, 2020
Sagar Dhara sagdhara@gmail.com
Your Comment if any
|